






You may have a server configuration with 8 Core CPU and 16GB or 32GB RAM, yet your WordPress website still frequently lags, the CPU hits 100%, or the server crashes when an advertising campaign drives in traffic. The problem is usually not the hardware, but the fact that the server has not been properly tuned. CyberPanel and the Linux operating system defaults are configured only at the minimum safe level to run on low-cost 1GB RAM VPS packages.
To fully unleash the power of the hardware, the process server performance optimization requires coordinated intervention across the Linux Kernel layer, system process limits, MariaDB database, PHP 8.x interpreter engine, OpenLiteSpeed web server, Redis cache, and WordPress application.
Below is a practical 7-layer tuning playbook compiled by the DPS.MEDIA technical team through hundreds of high-load server deployment projects for e-commerce platforms and multi-website ecosystems.
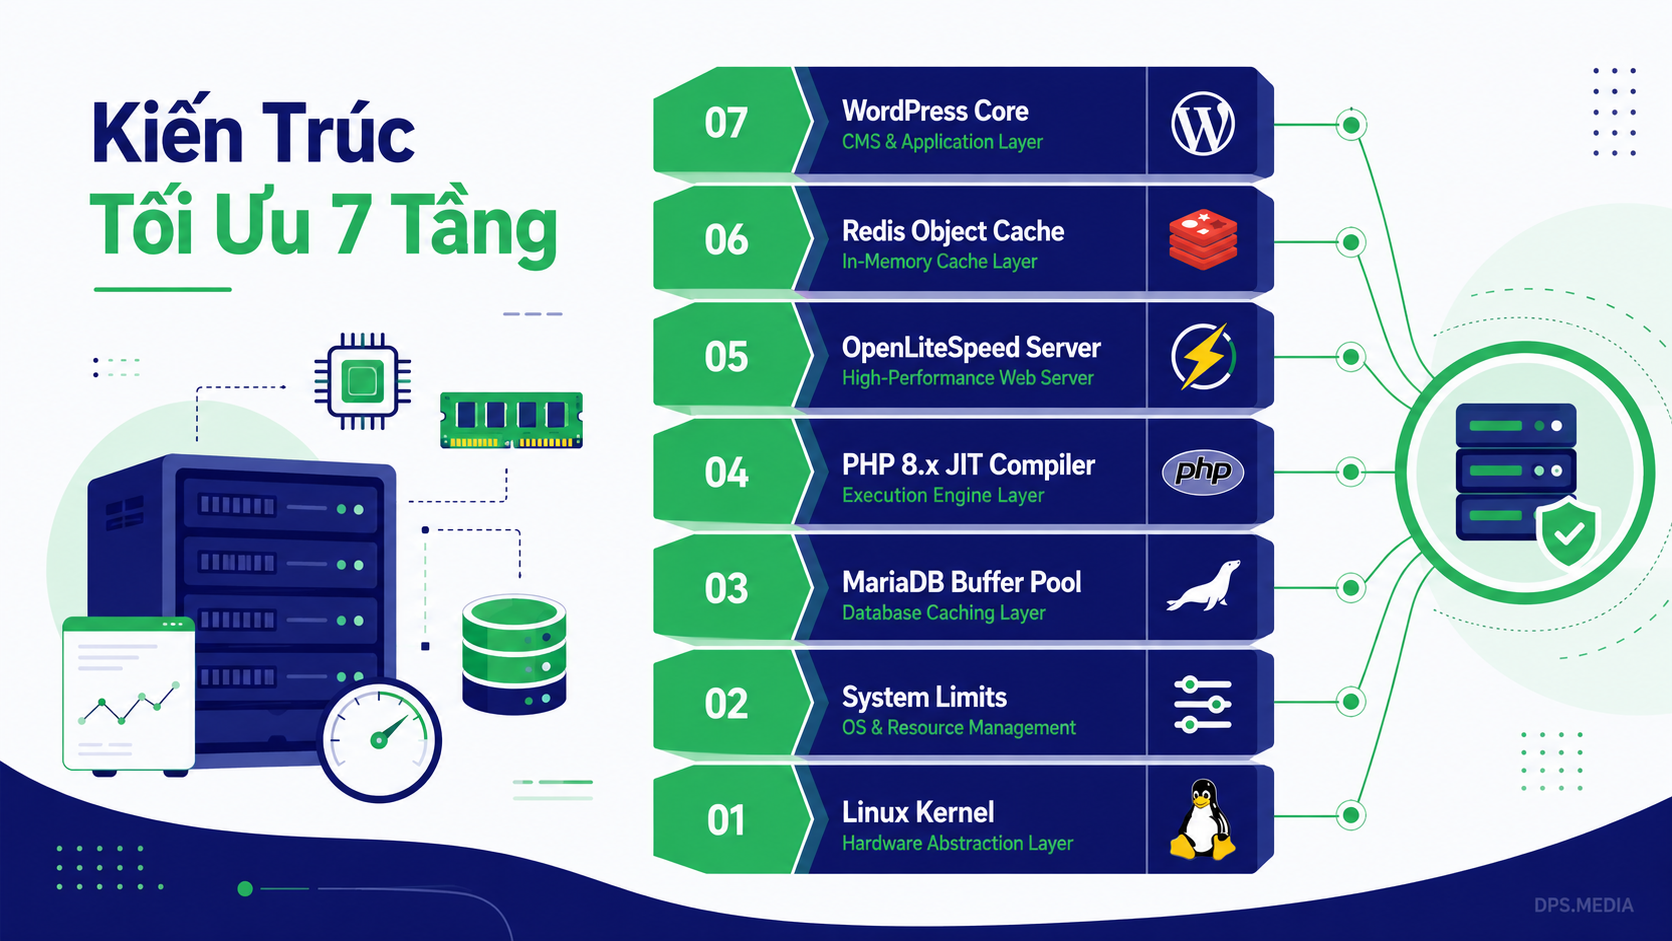
Layer 1: Tuning the Linux Kernel Layer (/etc/sysctl.conf)
The Linux Kernel layer coordinates hardware resources and TCP network queues. With the default configuration, Linux can easily push cached data to disk (Swap) even when physical RAM is still available, while also limiting the number of concurrent connections to a very low level.
Open the system configuration file with the command: nano /etc/sysctl.conf and add the following 4 groups of core parameters to the end of the file:
- 1. Optimize Memory & Swap:
•
vm.swappiness = 10(Use Swap only when RAM is truly exhausted below 10%).•
vm.vfs_cache_pressure = 50(Keep inode and directory caches in RAM longer).•
vm.dirty_background_ratio = 5&vm.dirty_ratio = 10(Write data from RAM to SSD smoothly). - 2. Increase System File Descriptors:
•
fs.file-max = 2097152(Allows more than 2 million files to be opened simultaneously).•
fs.inotify.max_user_watches = 524288 - 3. Increase TCP Queues & Reuse Connections:
•
net.core.somaxconn = 65535&net.ipv4.tcp_max_syn_backlog = 65535(Maximum socket queue).•
net.core.netdev_max_backlog = 65536•
net.ipv4.tcp_tw_reuse = 1&net.ipv4.tcp_fin_timeout = 15(Reclaim TIME_WAIT sockets after 15s).•
net.ipv4.tcp_keepalive_time = 300•
net.ipv4.ip_local_port_range = 1024 65535(Expand the outbound port range). - 4. Increase Network Buffer Capacity:
•
net.core.rmem_max = 16777216&net.core.wmem_max = 16777216(Allocate a 16MB buffer).•
net.ipv4.tcp_rmem = 4096 87380 16777216•
net.ipv4.tcp_wmem = 4096 65536 16777216•
net.ipv4.tcp_syncookies = 1(Prevent TCP SYN queue overflow).
Apply the new configuration immediately without restarting the server with the command:
sysctl -p
Layer 2: Expand Operating System Resource Limits (/etc/security/limits.conf)
A website suddenly returning 500 or 502 Bad Gateway errors when traffic spikes is often caused by the operating system reaching the limit on simultaneously open files (Too many open files). Every user connection, image file, database query, or PHP process consumes a File Descriptor.
Open the file nano /etc/security/limits.conf and add the following lines before the line # End of file to unlock the limits for system users (*, root, mysql, nobody):
- Maximum number of simultaneously open files (nofile): Settings
soft nofile 65535andhard nofile 65535for all processes. - Maximum number of simultaneous processes (nproc): Settings
soft nproc 65535andhard nproc 65535. - Memory lock (memlock): Settings
soft memlock unlimitedandhard memlock unlimited.
Layer 3: Optimize the MariaDB Database in RAM (/etc/mysql/mariadb.conf.d/99-tuning.cnf)
The biggest bottleneck in most WordPress websites is the disk read/write speed of the Database. By assigning most data and table indexes to RAM (InnoDB Buffer Pool), query response speed can increase by 5 to 10 times.
RAM allocation formula for innodb_buffer_pool_size:
| Physical RAM Configuration | Buffer Pool Allocation | Number of Instances |
|---|---|---|
| 8GB RAM VPS | 3GB – 4GB | 1 – 4 |
| 16GB RAM Server | 6GB – 8GB | 4 – 8 |
| 24GB – 32GB RAM Server | 8GB – 12GB | 8 |
| Dedicated Server 64GB+ RAM | 32GB | 16 |
Create a separate configuration file nano /etc/mysql/mariadb.conf.d/99-tuning.cnf with optimized parameters:
- InnoDB Engine:
innodb_buffer_pool_size = 8G,innodb_buffer_pool_instances = 8,innodb_log_file_size = 1G,innodb_log_buffer_size = 64M,innodb_flush_log_at_trx_commit = 2,innodb_io_capacity = 2000,innodb_io_capacity_max = 4000. - Connections & Query Cache:
max_connections = 500,max_user_connections = 400,wait_timeout = 60,table_open_cache = 4000,tmp_table_size = 128M,max_heap_table_size = 128M,join_buffer_size = 8M,sort_buffer_size = 8M,max_allowed_packet = 128M.
Restart the MariaDB service and check the actual RAM allocation:
systemctl restart mariadb
mysql -e "SHOW VARIABLES LIKE 'innodb_buffer_pool_size';"
Layer 4: Optimize the PHP 8.x Engine and JIT Compiler (php.ini)
PHP 8.2 and 8.3 deliver outstanding performance thanks to the JIT (Just-In-Time) Compiler architecture. However, without enough memory allocated for OPcache to store compiled bytecode, PHP will continuously have to read source code from disk, wasting CPU processing cycles.
In the CyberPanel interface, go to PHP → Edit PHP Configs → tab Advanced (or edit the file /usr/local/lsws/lsphp83/etc/php.ini):
- Memory & File Limits:
memory_limit = 1024M,max_execution_time = 120,max_input_time = 60,max_input_vars = 10000,post_max_size = 256M,upload_max_filesize = 256M. - Path Optimization:
realpath_cache_size = 16M,realpath_cache_ttl = 600. - Disable Excessive Statistics:
mysqlnd.collect_statistics = Off,mysqlnd.collect_memory_statistics = Off. - Enable OPcache:
opcache.enable = 1,opcache.memory_consumption = 512,opcache.interned_strings_buffer = 64,opcache.max_accelerated_files = 100000,opcache.validate_timestamps = 1,opcache.revalidate_freq = 60. - Enable PHP 8.x JIT Compiler:
opcache.jit = 1255,opcache.jit_buffer_size = 128M(Accelerate CPU arithmetic calculations).
Layer 5: Tune the OpenLiteSpeed Web Server (OLS WebAdmin)
OpenLiteSpeed uses an asynchronous Event-Driven model capable of serving tens of thousands of connections without exhausting memory. According to OpenLiteSpeed technical documentation, configuring the correct number of Worker processes and enabling Brotli compression can reduce transmitted packet size by up to 25% compared with traditional GZIP.
Log in to OpenLiteSpeed WebAdmin at port 7080 (e.g.: https://YOUR_SERVER_IP:7080) and perform two groups of settings:
1. Tune External Application (lsphp):
Case study: Businesses succeed thanks to automation Server Configuration → External App → select edit lsphp:
- Max Connections:
150(or200for a 16-core server) - Initial Request Timeout:
60| Retry Timeout:0 - Persistent Connection:
Yes| Response Buffering:No - Environment: Add two environment variable lines:
•
PHP_LSAPI_CHILDREN=150•
PHP_LSAPI_MAX_REQUESTS=5000 - Memory Limit: Enter
0| Process Limit: Enter1000(or0)
2. Enable Brotli Compression and Async SSL:
Case study: Businesses succeed thanks to automation Server Configuration → tab Tuning:
- Max Connections:
10000 - Enable Async OpenSSL:
Yes - Enable GZIP / Brotli Compression:
Yes - Brotli Compression Level: Set the level
4(achieving the optimal compression ratio without causing CPU congestion).
Click the green circular icon Graceful Restart in the upper-right corner to load the new configuration.
Layer 6: Deploy Redis Object Cache
WordPress can issue hundreds of repeated queries during each page load. Instead of making the database process the same query multiple times, Redis Object Cache stores the result directly in RAM with a response latency below 1ms.
Open the Redis configuration file nano /etc/redis/redis.conf (or /etc/redis.conf) and add two allocation parameters:
maxmemory 1024mb(Allocate 1GB RAM for the Redis cache)maxmemory-policy allkeys-lru(Automatically remove the oldest key when memory is full)
Restart the service: systemctl restart redis. Then, in the WordPress admin dashboard, install the plugin LiteSpeed Cache → go to [6] Object Cache → Enable ON → select protocol Redis (Host: 127.0.0.1, Port: 6379).
Layer 7: Optimize the WordPress Application Layer
Two hidden culprits behind sudden CPU load spikes on WordPress are the virtual WP-Cron process and the Heartbeat API mechanism.
1. Replace Virtual WP-Cron with Linux Crontab:
By default, whenever a visitor accesses the website, WordPress activates the file wp-cron.php. When traffic is high, thousands of virtual cron processes running simultaneously can immediately overload the server.
Open the file wp-config.php and insert the following line before /* That's all, stop editing! */:
define('DISABLE_WP_CRON', true);
Then open the Linux operating system crontab with the command crontab -e and schedule it to run every 10 minutes:
*/10 * * * * curl -s https://yourdomain.com/wp-cron.php?doing_wp_cron > /dev/null 2>&1
2. Control the Heartbeat API:
In the plugin LiteSpeed Cache → section Toolbox / Heartbeat:
- Frontend Heartbeat: Domain management and DNS configuration are the vital foundation that helps businesses ensure stable and secure online presence.
Disableto disable it completely on the frontend. - Backend & Editor Heartbeat: Increase the check interval to
60or120seconds.
TranslatePress will automatically skip all content contained within tags with this class.
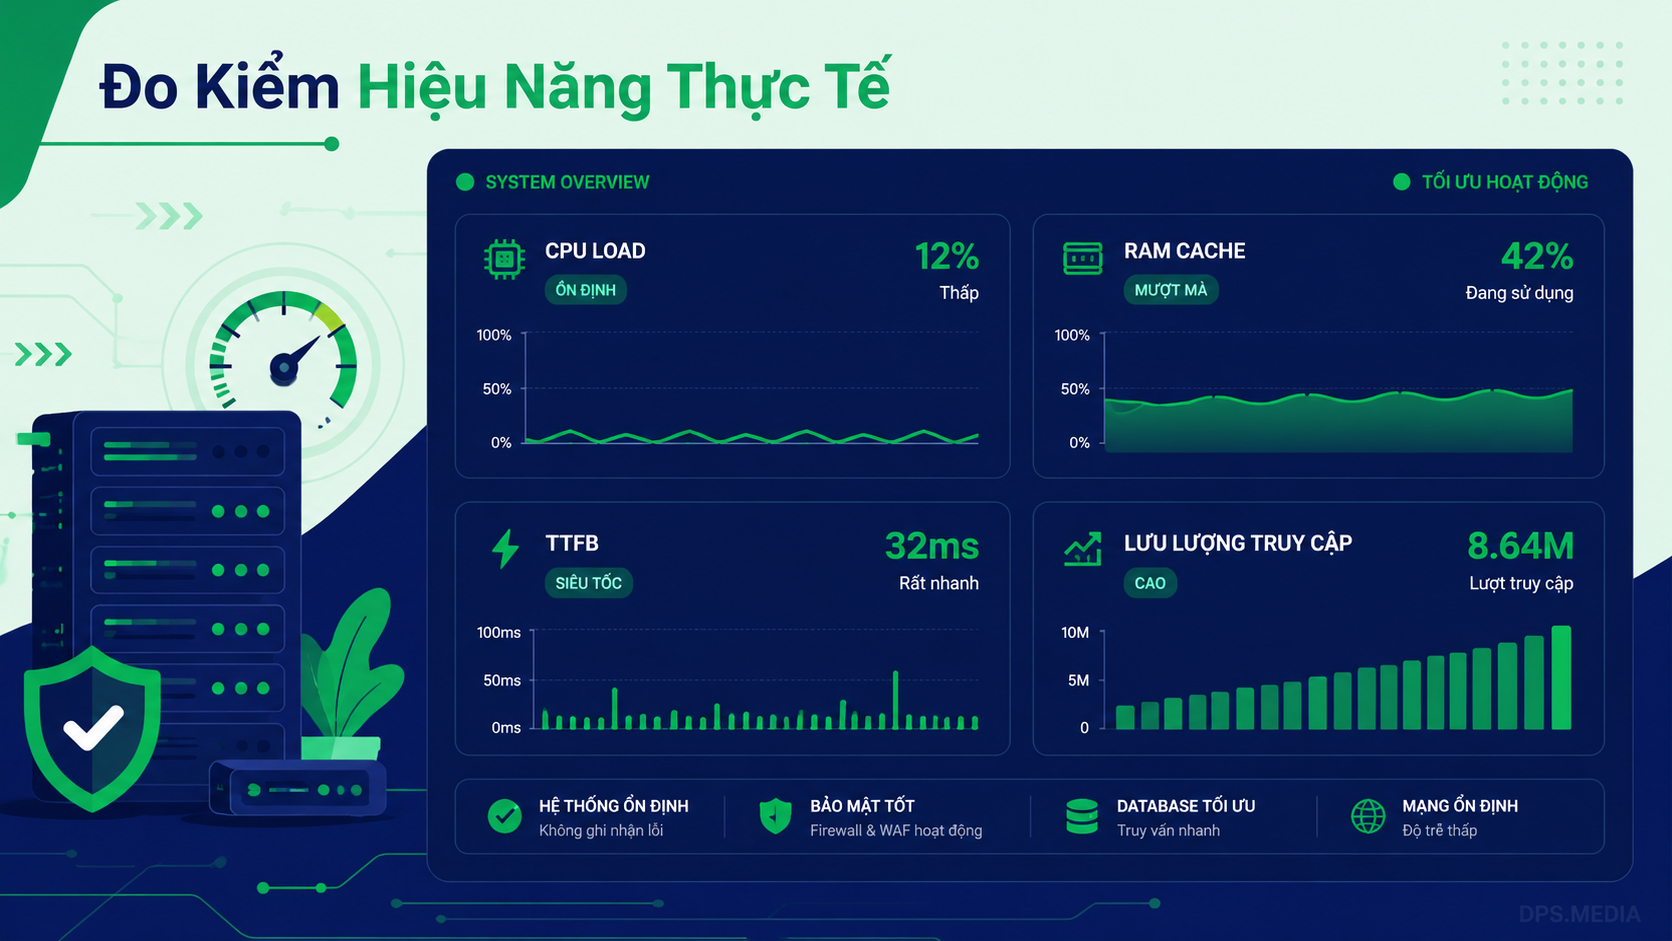
Server health check command set after deployment
After completing all 7 layers, run the following command sequence in the Terminal window to verify that all parameters have been correctly loaded into the system:
- Check MariaDB RAM:
mysql -e "SHOW VARIABLES LIKE 'innodb_buffer_pool_size';" - Check OPcache & JIT PHP 8.3:
/usr/local/lsws/lsphp83/bin/php -i | grep -E "opcache.enable|opcache.memory_consumption|opcache.jit" - Check open file limits:
ulimit -n - Check Kernel Sysctl:
sysctl vm.swappiness net.core.somaxconn fs.file-max - Monitor hardware in realtime:
htop
Actual Results After Server Performance Optimization
Measure actual performance at the e-commerce system Mộc Gia Interior after completing all 7 tuning layers: First Contentful Response Time (TTFB) dropped significantly from 920ms to 38ms, while concurrent processing capacity increased from 220 connections to more than 3.100 active users at the same time with CPU consumption remaining stable below 20%.
If your business is struggling with server overload, slow website loading, or needs to build stable digital infrastructure for advertising campaign traffic spikes, explore high-speed website design and VPS infrastructure services at DPS.MEDIA or contact the hotline/Zalo directly 0961545445 to receive detailed technical consultation.
Ý kiến bạn đọc (9)
Đăng nhập để bình luận
Đăng nhập nhanh 1-chạm bằng Google để chia sẻ ý kiến của bạn về bài viết.
Bằng cách đăng nhập, bạn đồng ý với điều khoản và chính sách cộng đồng.
Chưa có bình luận nào. Hãy là người đầu tiên chia sẻ cảm nghĩ!
Đăng nhập / Tạo tài khoản
Đăng nhập với Google để gửi bình luận và tương tác cùng cộng đồng.
Tiếp tục là đồng ý với điều khoản sử dụng và chính sách bảo mật của DPS Media.